
Atmospheric rivers wreak havoc in the US Pacific Northwest
Recent flooding across the Pacific Northwest highlights the recurring impact of atmospheric river events on the region. A powerful winter storm, fueled by huge quantities of moisture transported across the Pacific Ocean, has brought widespread flooding to Oregon and Washington in the US, and British Columbia in Canada. Much like the flooding which hit the same region in November 2021 (JBA Event Response, 2021), this event was driven by a potent atmospheric river - a long narrow band of condensed water vapour in the atmosphere (National Oceanic and Atmospheric Administration, 2025) - underscoring the risk these weather systems pose to Pacific Coast communities.
Media coverage has focused on dramatic images of inundated towns, closed highways, and the heroic efforts of emergency responders. Yet the true impacts of flooding extend long beyond the point at which waters recede. Families and businesses face months, and often years of recovery, navigating clean-up, repair, economic disruption, and emotional strain.
While federal, state, and local assistance plays a key role in post-flood recovery in the United States, it often falls short for those without flood insurance. A significant proportion of households and small businesses remain uninsured, leaving them highly exposed to financial loss and prolonged disruption following major flood events. Affordable and accessible flood insurance remains one of the most effective tools for closing this protection gap, but doing so requires robust data and tools to quantify the risk and price coverage.
Overview and timeline
Following several days of prolonged and intense rainfall, large areas of the Pacific Northwest — particularly along the US-Canada border experienced significant and widespread flooding, along with landslides, levee failures, infrastructure damage, and multiple large-scale evacuations.
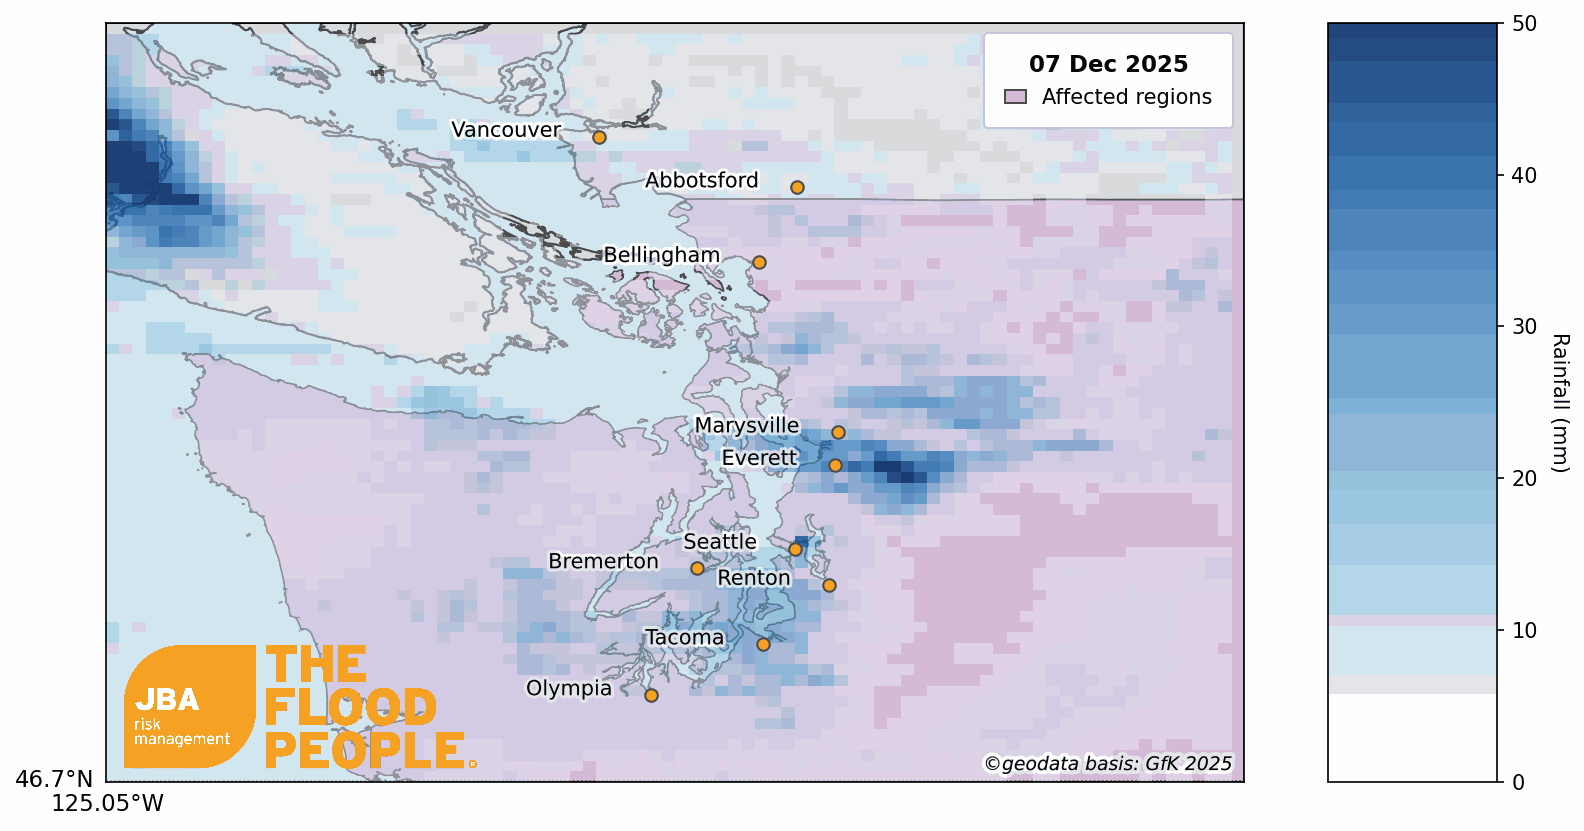
The weather began to deteriorate after 7 December, when an atmospheric river made landfall, transporting enormous volumes of water vapour from the central Pacific Ocean. Meteorologists estimate that more than 5 trillion gallons of rain (Russo, 2025) fell across Washington State in the space of a single week. The animation in Figure 1 shows the extent and intensity of rainfall as it swept across the region around Seattle in the US and Victoria in Canada.
In response to rising river levels, local authorities across Washington and Oregon issued widespread flood warnings and evacuation orders. These decisions were largely guided by FEMA’s Special Flood Hazard Area (SFHA) maps or Flood Zones (Smith and Reilly, 2025), which delineate areas exposed to the estimated 100-year fluvial (river) flood and are commonly used as the basis for emergency planning and response.
At the peak of the event, up to 100,000 people across Washington State received evacuation orders (Smith and Reilly, 2025). Impacted areas included Skagit County, Mount Vernon, Sedro-Woolley, Orting, Ebey Island, Burlington (Anguiano, 2025) and low-lying land along the Puyallup River and around Sumner (Johnson, 2025), where floodwaters have threatened homes, businesses, and infrastructure. Similar flood warnings and evacuation orders were also issued in southern British Columbia, where communities faced comparable river and surface water flooding.
River gauge information (return period analysis)
Record flood levels were observed at multiple river gauges (Shackelford and Erdman, 2025) across the state, including the Skagit River near Mount Vernon and the Snohomish River at Snohomish. Several other rivers – including the Nooksack and Sumas (Russo, 2025) – also reached or exceeded record levels, inundating surrounding communities and countryside. Extreme value analysis on data from the Snohomish River near Monroe (Figure 2) suggests that the maximum observed stage, 24.55 ft, is equivalent to a 300-year return period event.

The role of atmospheric rivers
According to NASA (NASA, 2025), the atmospheric river responsible for this flooding extended nearly as far as the Philippines — a distance of approximately 11,000 kilometres from Washington State’s coastline. The sheer length of this moisture corridor allowed it to accumulate exceptionally large volumes of precipitable water (Russo, 2025) before making landfall.
Atmospheric rivers are one of the most significant natural hazards affecting the West Coast of the United States and Canada. These long, narrow bands of moisture-laden air transport water vapour from warm tropical regions to higher latitudes (NASA, 2025), where it is released as intense rainfall or snow.
The US West Coast is particularly vulnerable to atmospheric rivers forming over the Pacific Ocean, which regularly bring heavy precipitation to California (JBA Event Response, 2022), Oregon (Foden-Vencil, 2025), and Washington (JBA Event Response, 2021). While these systems are vital for regional water supply, they are also responsible for many of the most severe flood events on record.
JBA’s new US Inland Flood Model
Events like the 2025 Pacific Northwest floods underline the urgent need for robust flood risk data and models to support insurers with closing the flood insurance gap in the US. Comparison of JBA’s 100-year 5m fluvial and pluvial (surface water) maps in the area around Sumner (Figure 3) shows notable differences with FEMA’s flood zones. In this example, FEMA’s flood zones closely follow the course of the White and Puyallup Rivers, in contrast to JBA’s flood maps, which indicate broader fluvial inundation and large areas of pluvial flooding. Together, these differences demonstrate how enhanced flood modelling can provide a more complete picture of risk, supporting insurers in expanding coverage and improving resilience.

JBA’s US Inland Flood Model is designed to support insurers, reinsurers, and policymakers in better quantifying flood risk and expanding access to flood insurance for vulnerable communities where it is needed most. Importantly, it covers all sources of inland flood risk across the 48 contiguous US states, including fluvial and pluvial flooding, and accounts for the full range of storm types – from hurricanes and tropical storms to extratropical cyclones and frontal systems.


