
A look back at Isaias and widespread flooding across the southeastern US
Hurricane Isaias brought destructive winds, coastal flooding and heavy rainfall to the Florida Panhandle and parts of the southeastern United States in October 2026. The hurricane rapidly intensified over the southwest Gulf, reaching Category 3 before weakening ahead of landfall. Isaias made landfall near Destin, Florida, at approximately 20:30 CDT on 9 October as a Category 2 hurricane.
The event caused significant human and economic impacts across the southeastern United States, resulting in nine fatalities, extensive wind damage, fallen trees, flooding and power outages affecting communities across the Florida Panhandle and neighbouring states (FPREN, 2026). Total insured losses were estimated at USD $5 billion, with total economic losses amounting to USD $16-20 billion. Counties in the Florida Panhandle and southern Alabama were the hardest hit.
The event highlights the multiple hazards associated with landfalling tropical cyclones. Although wind accounted for the majority of insured losses, storm surge and intense rainfall also caused coastal, surface-water and river flooding, underlining the importance of considering flood exposure alongside hurricane wind risk.
Overview and timeline
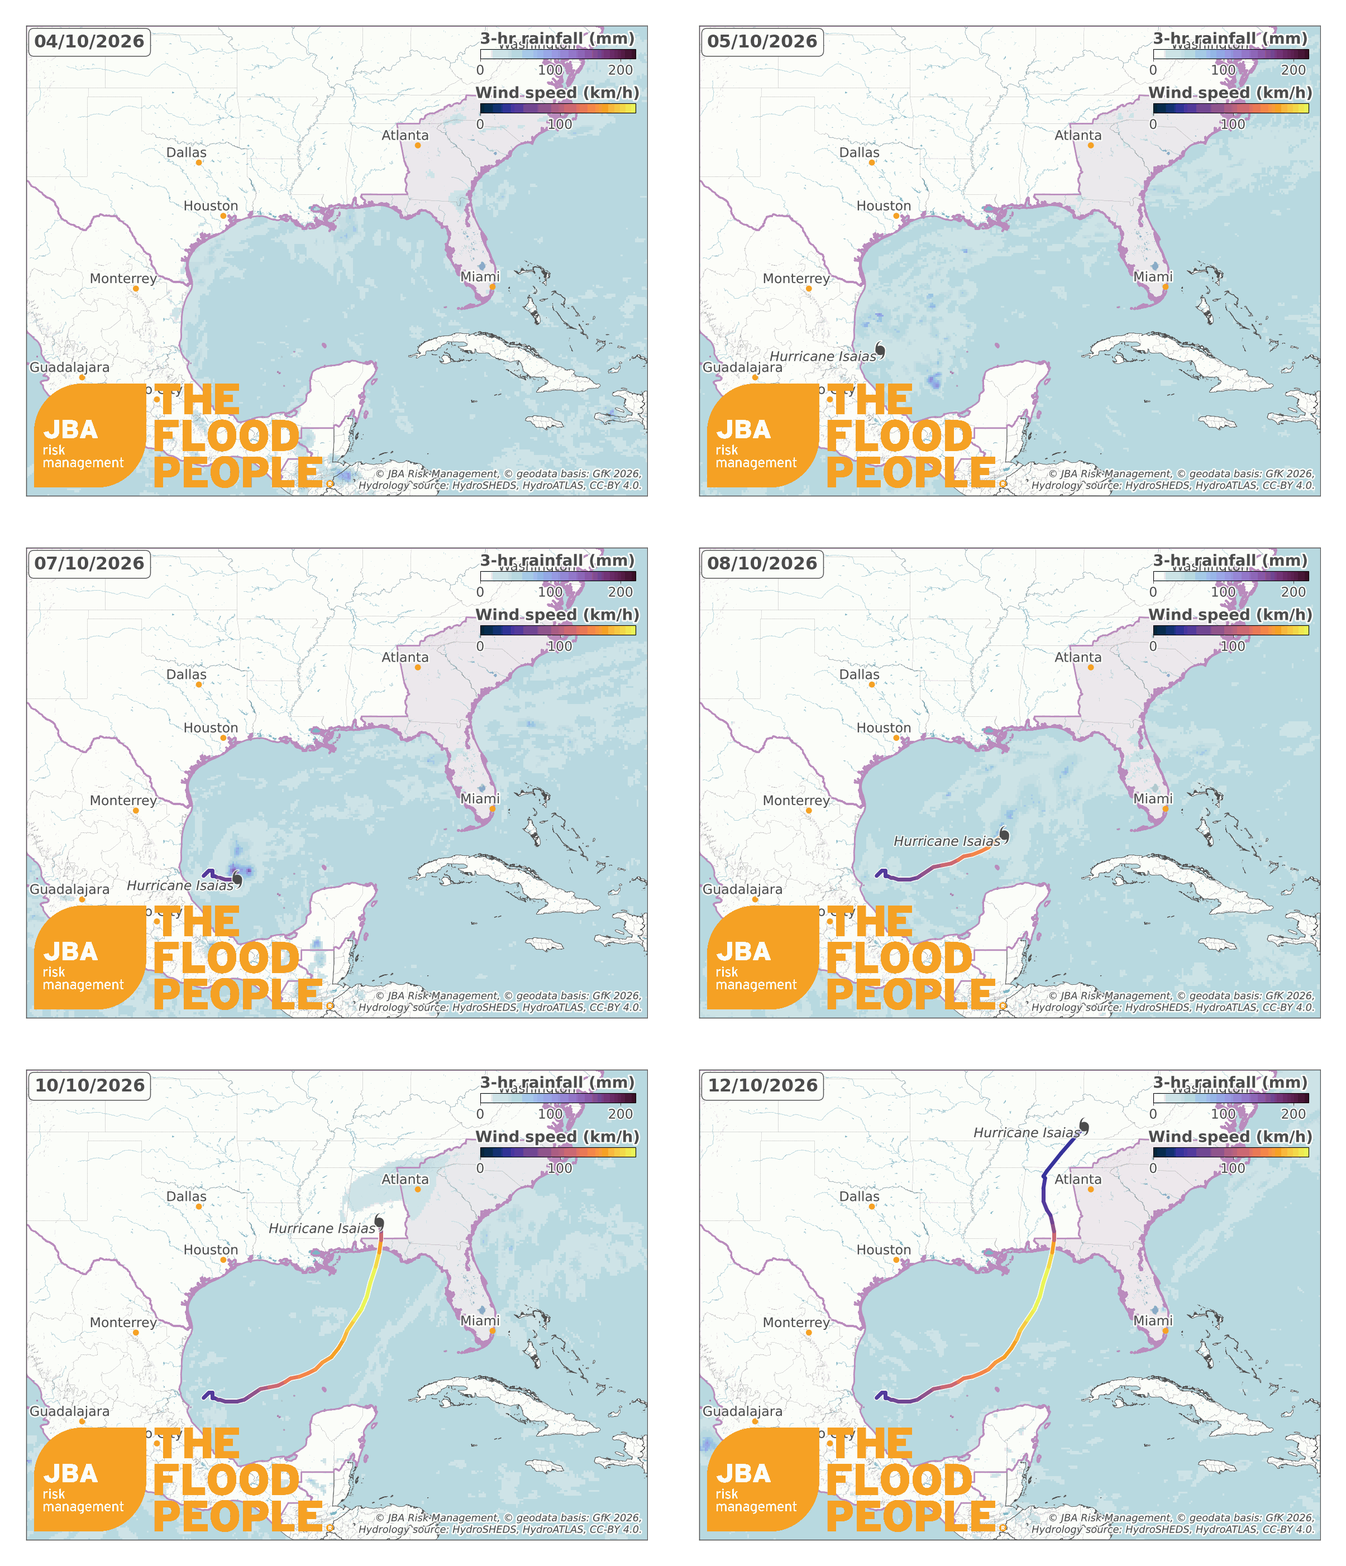
Isaias became a tropical storm over the Gulf on 7 October, when maximum sustained winds were approximately 40 mph (65 km/h). The hurricane continued to strengthen over the Gulf and eventually reached Category 3 intensity, with maximum sustained winds of 120 mph (193 km/h). Increasing wind shear subsequently weakened Isaias to a Category 2 hurricane as it approached the coast and made landfall near Destin, Florida, on 9 October.
The storm continued its path northwards and brought intense tropical storm winds to Alabama, before weakening into a post-tropical cyclone as it tracked further north towards the Appalachians. An animation of the hurricane’s track is shown in Figure 1.
Timeline of Hurricane Isaias:
- 7 October: The system strengthened into Tropical Storm Isaias over the Gulf. At 04:00 CDT, maximum sustained winds were 40 mph (65 km/h), and rapid strengthening was forecast (NHC, 2026a).
- 8 October: Isaias continued to strengthen while approaching the northern Gulf Coast. The storm ultimately developed into a hurricane and continued intensifying (NWS Tallahassee, 2026).
- 9 October: Isaias reached Category 3 intensity over the Gulf, with maximum sustained winds of 120 mph, before potentially weakening as it approached the coastline (The Economic Times, 2026, 2026).
- 9 October, approximately 20:30 CDT: Isaias made landfall near Destin, Florida (ABC7, 2026), as a Category 2 hurricane with maximum sustained winds of 75 mph. It was expected to move east-northeast at a speed of 9 mph.
- 10 October: Isaias weakened rapidly over Alabama and transitioned into a post-tropical cyclone. Heavy rainfall and a continuing flash-flood risk remained across parts of the southeastern United States (NHC, 2026b).
Impacts and industry response
Six deaths were reported in Florida, two in Alabama and one in South Carolina. Reported causes included fallen trees, carbon monoxide poisoning and other storm-related incidents (FPREN, 2026). Wind damage was significant as powerful winds reached the Florida Panhandle. The worst wind damage was reported to the west of the landfall location, particularly across Santa Rosa and northeastern Escambia counties.
Pensacola also experienced considerable disruption. Hurricane-force winds damaged roofs and businesses, while more than 100,000 customers in Escambia County were reported without power immediately following the hurricane (The Weather Channel, 2026).
Coastal communities east of the landfall location experienced significant storm-surge impacts. The Panama City Beach Pier tide gauge recorded a maximum water level of 5.60 ft (1.71 m) above Mean Higher High Water, the second-highest water level recorded at the gauge after Hurricane Opal in 1995.
Storm surge and heavy surf caused extensive beach erosion, damage to seawalls and boardwalks, and submerged coastal roads across Walton, Bay, Gulf and Franklin counties (NWS Tallahassee, 2026).
As Isaias moved inland, persistent rainbands brought heavy rainfall to the western Florida Panhandle and southeastern Alabama, causing urban and flash flooding (NHC, 2026b). The National Weather Service reported a storm-total rainfall of around 4–8 inches (102–203 mm) across coastal and western areas.
The rainfall also caused local creeks and rivers to reach minor-to-moderate flood levels. The highest rainfall totals recorded were 12.47 inches (317 mm) at DeFuniak Springs, Florida, and 10.01 inches (254 mm) at Elba, Alabama (NWS Tallahassee, 2026).

A state of emergency was declared in 25 counties, with FEMA Individual Assistance made available to residents in eight counties requiring recovery aid. As of 6 November 2026, the total estimated insured losses reported by the Florida Office of Insurance Regulation was more than USD $735 million. Residential properties account for the greatest share in insured losses as they account for over 80% of claims and 88% of the insured loss (Florida Office of Insurance Regulation, 2026).
Santa Rosa County reported the highest number of claims, followed by Escambia and Okaloosa (Figure 3). Across all affected states, insured losses were estimated to be over USD $5 billion (The Insurer, 2026), with USD $16-20 billion in total damage and economic loss (AccuWeather, 2026).

For insurers, reinsurers, lenders and other property-risk managers, Isaias highlights why hurricane wind intensity alone does not describe the full spatial distribution of property risk. High-resolution flood hazard information can complement wind catastrophe modelling by identifying locations susceptible to storm surge, surface-water and river flooding.
JBA's flood hazard data and catastrophe-modelling capabilities can support portfolio assessments across multiple sectors, helping organisations identify concentrations of flood exposure, assess risk at individual properties and understand how an event compares with underlying baseline risk.
Notable historical events
The Florida Panhandle is particularly exposed to hurricanes due to its location along the northern Gulf coast. Warm waters from the Gulf provide fuel for tropical cyclone development, while background steering winds often push storms northwards towards the coast. The Florida Panhandle has experienced several destructive hurricanes, including Opal in 1995, Ivan in 2004, Michael in 2018 and Sally in 2020.
Hurricane Opal, 1995
Hurricane Opal made landfall along the Florida Panhandle near the Okaloosa-Santa Rosa County line on 4 October 1995, with maximum sustained winds of approximately 125 mph. Contemporary estimates placed insured losses at approximately USD $2.1 billion and total insured and uninsured losses at USD $3 billion or more. Approximately 3,300 structures were destroyed and more than 18,000 were damaged (NCDC, 1995).
Hurricane Ivan, 2004
Hurricane Ivan made landfall just west of Gulf Shores, Alabama, on 16 September 2004 as a Category 3 hurricane, with maximum sustained winds of approximately 120 mph. Total damage was estimated at around USD $14 billion, while eight direct fatalities were recorded in the western Florida Panhandle. Escambia and Santa Rosa counties were among the worst-hit areas (NWS Mobile/Pensacola, 2004).
Hurricane Michael, 2018
Hurricane Michael made landfall near Mexico Beach and Tyndall Air Force Base in the Florida Panhandle in October 2018 as a catastrophic Category 5 hurricane. Michael was directly responsible for 16 deaths and caused approximately USD $25 billion in damage across the United States (NHC, 2019).
Hurricane Sally, 2020
Hurricane Sally made landfall along the Alabama coast in September 2020 as a Category 2 hurricane. The storm brought damaging winds across Alabama and the western Florida Panhandle, substantial storm surge and record river flooding caused by heavy rainfall. Sally resulted in four direct fatalities and an estimated USD $7.3 billion in damage across the United States (NHC, 2021).

These historical events illustrate how different hazards contribute to catastrophe losses across the region. Hurricane Michael was dominated by catastrophic wind and storm-surge impacts, while Hurricane Sally was particularly notable for extreme rainfall and river flooding. For Isaias, early loss estimates indicate that wind represented the principal driver of insured loss despite significant rainfall and coastal flooding.
Conclusion
Hurricane Isaias demonstrates how a rapidly intensifying hurricane over the Gulf can cause widespread damage from multiple hazards. Damaging winds and coastal flooding affected the Florida Panhandle, whilst heavy rainfall caused further flooding hundreds of miles inland, including in the mountains of western North Carolina.
For insurers, reinsurers, mortgage lenders and other property-risk managers, Isaias reinforces the importance of assessing hurricane-related flood risk alongside wind risk. JBA’s flood hazard data, catastrophe models and event-response analysis can help organisations identify where the extent and severity of flooding could occur and assess how events compare with baseline risk. These insights support more informed decisions about managing both current and future flood risk.


