
Major flooding grips Townsville, extending across North Queensland
Early in February, torrential rain inundated several parts of North Queensland in Australia, leading to hundreds of evacuations in Townsville, Cardwell and Ingham, power outages and the collapse of the Ollera Creek Bridge (Guardian, 2025a). At least two people have died due to this severe weather event (Sky News Australia, 2025). The Australian Government announced an $8 million AUD community relief fund for the impacted councils (ABC News, 2025a). As of 12 February 2025, insurers had received over 5,690 claims for flood damages (Insurance Council of Australia, 2025). JBA estimates insured losses to be in the $200-400m AUD range. We will update this view as more information about the impacts of the event emerge.
Event timeline and impacts
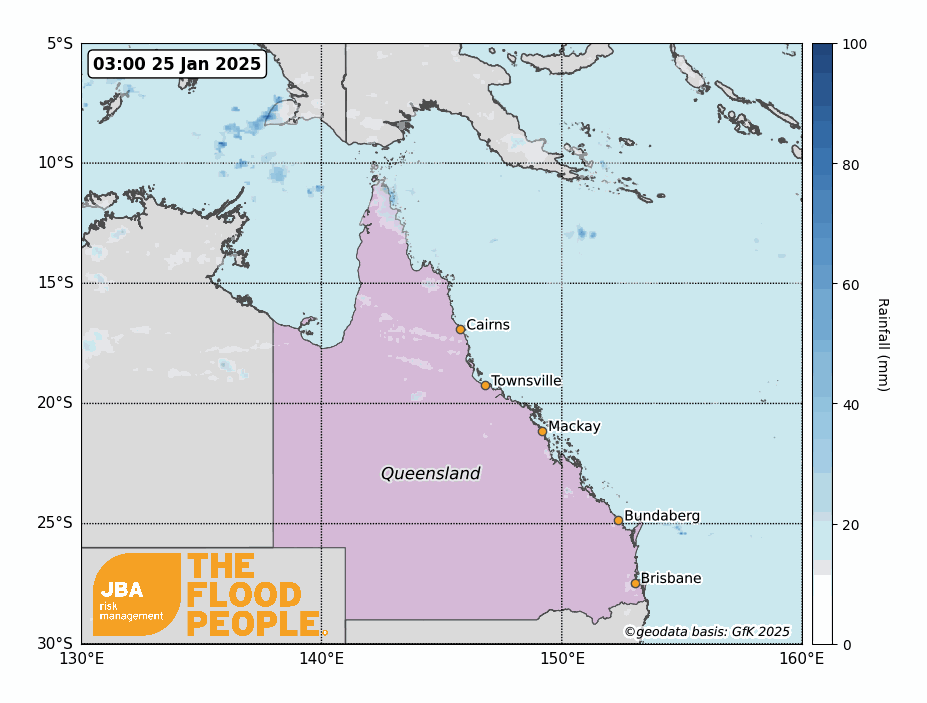
The Queensland floods of February 2025 were driven by a persistent tropical low-pressure system, which brought extreme rainfall across north-eastern Queensland. The event unfolded over several days, with prolonged heavy rainfall and subsequent riverine and flash flooding.
On 3 February 2025, intense rainfall was recorded across the Townsville and Hinchinbrook regions, with Paluma receiving 175 mm within three hours (BoM, 2025a). The Herbert river at Ingham surged beyond its historical flood levels, causing widespread inundation of homes and businesses. Emergency services responded to multiple calls for assistance, including rooftop rescues as floodwaters rose rapidly. In Townsville, the Ross River Dam reached 163.8% capacity, triggering mandatory evacuations in several low-lying suburbs (Reuters, 2025).
By 4 February, floodwaters had severely impacted transport networks, power infrastructure and essential services. Approximately 6,700 properties lost power due to forced substation shutdowns. Major highways, including the Bruce Highway, were cut off, isolating communities in Hinchinbrook, Innisfail, and surrounding areas. A section of Ollera Creek Bridge, which links Ingham and Townsville, was washed away, prompting urgent calls for infrastructure upgrades (ABC News, 2025b).
The Queensland Government declared a disaster situation, allowing for federal disaster assistance grants to be activated for affected residents (Queensland Government, 2025). The Australian Defence Force (ADF) was deployed to assist with evacuations, logistics and recovery operations.
By 5 February, as floodwaters slowly began to recede, the full extent of the damage became clearer, with thousands of properties affected, businesses disrupted, and two confirmed fatalities. The event has drawn renewed calls for long-term flood mitigation strategies, particularly as climate trends indicate an increasing risk of extreme weather events in northern Australia (ICA, 2025).
Meteorological overview
From November to April, northern Australia typically experiences heavier rainfall due to the Australian Summer Monsoon, driven by the north-western monsoon winds. These winds create tropical low-pressure systems, which can develop into cyclones under the right conditions.
In addition to the prevailing monsoon winds, two other atmospheric phenomena – the Madden-Julian Oscillation (MJO) and the Equatorial Kelvin Wave (EKW) – influence the formation of low-pressure cells across Australia and played a role in shaping the 2025 Queensland floods. The MJO, a large-scale atmospheric disturbance, affects tropical convection and rainfall patterns, moving eastward across the Indian and Pacific Oceans. According to the Bureau of Meteorology (BoM, 2025a), a moderate to strong MJO pulse was observed passing over the Maritime Continent on 3 February, likely enhancing convective activity.
The EKW, another eastward-moving atmospheric phenomenon, moves along the equator and typically influences storm activity over shorter timescales. On 3 February 2025, BoM detected a latent heat flux change north of Australia, which likely intensified convection and contributed to increased storm activity (BoM, 2025).
On 4 February, BoM (2025a) reported the formation of four pressure cells – 13U, 14U, 15U, and 16U – a rare occurrence last observed in 2014. Of these, Tropical Low 13U persisted the longest, remaining closest to the Queensland coast, where it contributed to exceptional rainfall totals exceeding 700 mm across many locations (Figure 2).

The MJO and EKW worked in tandem with the prevailing monsoon, amplifying the impacts of the tropical low-pressure systems. While the MJO created favourable conditions for cyclonic activity and heavy rainfall, the EKW likely intensified convection, strengthening the storm systems. This complex interaction, coupled with above-average sea surface temperatures, underscores the growing influence of climate variability and long-term warming trends on extreme weather events in Australia (IPCC, 2021).
Extreme rainfall and river levels
The monsoon-driven floods in northern Queensland can be largely attributed to the extreme rainfall levels observed, particularly along the coast (Figure 3). In some regions, total rainfall for the week exceeded 1,000 mm, with several sites experiencing their highest recorded totals between 2 and 4 February. Notably, Cardwell Range recorded a daily total of 626 mm on 3 February, contributing to a highest weekly total of 1,697 mm (BoM, 2025b). Additionally, Townsville Airport received 545 mm of rainfall over 48 hours, while Rollingstone recorded 730 mm in just 24 hours (BoM, 2025b).

JBA has conducted Extreme Value Analysis with a Peaks-Over-Threshold and Generalised Pareto distribution methodology for several locations based on rainfall and river level gauge data (Figure 4). While most areas experienced rainfall within the 1-in-30-year return period, certain sites saw extreme levels, including Cardwell. The most significant extreme for rainfall and river levels were observed at Rollingstone, where the return period is estimated at over 1-in-1,700 years, and Alligator Creek which has a 1-in-184-year return period.

Notable historical events
Queensland has experienced numerous catastrophic flood events over the past few decades, driven by extreme rainfall, monsoonal systems, and tropical cyclones. While historic events, such as the 2010–11 Queensland floods, remain among the most devastating in terms of scale and economic loss, recent floods in 2019, 2022, and the ongoing 2025 event highlight an increasing trend of extreme weather patterns, infrastructure vulnerability, and rising financial impacts.
A key trend across these events is the rising financial and infrastructure costs, driven by urban expansion (QRA, 2022), climate variability, and the increasing intensity of rainfall events (Queensland Department of Energy and Climate, 2024). While floods in the past were largely riverine, recent events have exhibited a wider geographic spread and more prolonged impact, affecting both urban and rural communities (QRA, 2024). Government responses have evolved, with improved forecasting and relief efforts, but continued investment in flood resilience and mitigation is crucial to managing future risks (ICA, 2024a).

Table 1: 1 AUD is approximately 0.50 GBP or 0.63 USD. More information about Tropical Cyclone Jasper, the 2022 Eastern Australia Floods and the 2019 Townsville Floods can be found in our previous event reports.
Climate change
Historically, Queensland’s flood patterns have been influenced by natural climate variability (link to table above). However, the heavy precipitation that triggered this event has been attributed to human-driven climate change with natural climate variability playing only a minor role (ClimaMeter, 2025). According to ClimaMeter (2025), which is a rapid framework for understanding extreme weather events in a changing climate, the meteorological conditions associated with this event are up to 20% wetter and 1.5 °C warmer than in the past (1979–2001), whilst offshore wind speeds are up to 20% stronger. Together, these factors strengthened the event, increasing the likelihood and severity of flooding.
Climate models project (with medium confidence) that heavy rainfall events will become more frequent in northern and eastern Australia as global mean surface temperatures continue to rise (IPCC, 2022). This will increase the risk of river flooding and, given these changes, the 2025 floods align with broader global patterns of amplified hydrological extremes, necessitating further resilience planning and adaptation strategies to mitigate future flood risk (ICA, 2025).
This report is accompanied by a flood footprint for the event - detailing extents and depths of the flooding in areas affected in North Queensland. Download it via our Client Portal or request a copy by emailing eventresponse@jbarisk.com.
Australia Inland Flood Model
Loss estimates are generated using JBA's new Australia Inland Flood Model which is due to be released shortly. We also have comprehensive river and surface water hazard maps for Australia. Get in touch with our team to find out more.


