
Weather whiplash brings California to a standstill: December 2022
On the back of a historic drought, deadly storms have brought incessant rainfall to California, inundating much of the state’s coastline, farmland and valleys (New York Times, 2023a). The widespread flooding has killed at least 20 people and more than 200,000 businesses and homes were left without power (CA.gov, 2023; Fox News, 2023). Over 96,000 people were placed under evacuation orders, whilst the National Weather Service issued flood watches for approximately 90% of the state’s population (Guardian, 2023a). President Biden declared a major disaster in California on 14 January 2023 and approved emergency declarations from 41 of California’s 58 counties (Guardian, 2023b). The economic losses are estimated to be USD $30 billion and upwards (Bloomberg, 2023).
Event timeline
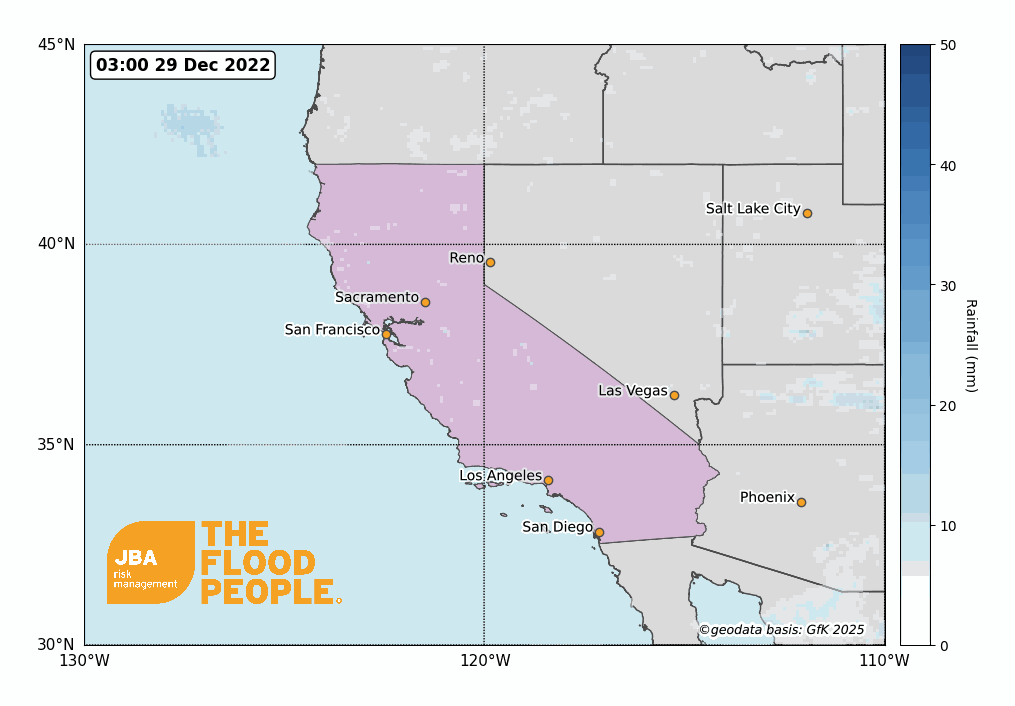
The west coast of the USA experienced a series of consecutive storms from 26 December 2022 to 16 January 2023, bringing heavy rainfall and snow to California. During this time, the storms resulted in hurricane-force winds, flash flooding and debris flows, and have raised rivers to dangerous levels. California has received an average of 23cm (9 inches) of rainfall since late December with some areas having already seen the typical amount of rainfall for the entire year.
The first period of heavy rain arrived on 26 December 2022. This event was short-lived and brought beneficial rain to an area suffering long-term drought. A second spell of wet weather then made landfall between 29 December 2022 and 1 January 2023, of longer duration than the first, bringing hazardous conditions across the state. On 31 December, San Francisco registered its second wettest day in recorded history. Further spells of heavy rain hammed the west coast through the first two weeks of January, slowly shifting southwards across the state and exacerbating the existing flood conditions on the ground. By 17 January, weather conditions across California gradually became more settled.
What caused the event
The main drivers behind the persistent stormy weather are phenomena known as atmospheric rivers. These are essentially bands of concentrated moisture high in the atmosphere carried along by the jet stream and are typically associated with wet weather conditions. The atmospheric rivers that commonly affect the west coast of the US during the winter form as winds over the Pacific. They draw warm, moist air up from the Hawaiian tropics, earning them the name “Pineapple Express” by locals. When these areas of enhanced moisture collide with the Californian mountain ranges, the air is forced upwards and dumps large quantities of rain out, leading to flash floods and rising river levels. Atmospheric rivers are categorised by both their intensity and impacts on the ground using a scale developed by Ralph et al (2019), ranging from 1 (primarily beneficial) to 5 (primarily hazardous). Table 1 shows the timeline of atmospheric rivers affecting western USA and their associated categories.

As they meandered across the Pacific, the atmospheric rivers became breeding grounds for developing areas of low pressure, carrying these systems across the ocean towards the states of California, Oregon and Washington. Due to their severity, these storms have been labelled as “bomb cyclones” - this is a term used to describe an extratropical cyclone whose central pressure drops rapidly, strengthening the storm unusually quickly. In order to be classed as a bomb cyclone, the pressure inside the cyclone needs to drop by a minimum of 24 millibars in 24 hours. As the pressure drops inside a cyclone, air is sucked away from the surface; surrounding air is then quickly pulled in to replace this, creating violent wind speeds. In fact, the wind speeds within bomb cyclones can sometimes reach levels normally associated with low-strength hurricanes (American Meteorological Society, 2023; Sky News, 2022).
Until recently, California was experiencing a decades-long drought (the worst in around a thousand years), which left the soil parched and unable to soak up large volumes of water quickly. This meant that the ground conditions were extremely vulnerable to flash flooding. The abrupt see-saw between the extreme weather conditions – drought to heavy rain – is sometimes referred to as “weather whiplash” and can catch local residents off guard.
Widespread impacts
Many parts of California received rainfall totals between 400-600% higher than normal. On 9 January, with flood waters rising and widespread power outages affecting over 100,000 homes, President Joe Biden declared an emergency, leading to the evacuation of over 34,000 residents across the state. At least 20 people are known to have died, mostly due to falling trees (in high winds) or driving through flood waters. On 11 January, forecasting service AccuWeather estimated that economic losses are likely to be in the region of USD $30 billion (Vox, 2023; CNN, 2023a; Al Jazeera, 2023; Time, 2023; AccuWeather, 2023).

Notable historic events
Atmospheric rivers are commonplace along the west coast of the US during the autumn and winter months.

Return period analysis
JBA conducted Extreme Value Analysis on historic rainfall data in order to estimate the return period of the event, focusing on San Luis Obispo County. We fit a Weibull distribution to a 44-year daily rainfall climate data timeseries from NOAA (2023) to produce a rainfall exceedance probability curve near the town of Templeton, just south of Paso Robles. The curve is shown by the solid orange line in Figure 3, with the 70th percentiles given by the dashed lines. The observed 24-hour rainfall total of 135.6mm at the Templeton recording station (shown by the blue line) suggests around a 1-in-100-year rainfall event at this location.

The exceedance probability of streamflows in San Luis Obispo and Merced counties were calculated using daily mean watercourse discharge data from the United States Geological Survey (USGS, 2023). The data were fit with Generalised Pareto Distributions to produce exceedance probability curves at two locations - the Salinas River at Paso Robles in San Luis Obispo County and the Salt Slough stream in Merced County – and are shown in Figures 4 and 5. Both these locations recorded streamflows with estimated return periods of around 50 years during the event.


Climate change implications
Global Climate Models (GCMs) are a useful tool that allow us to assess future climate trends and their implications for society; they can therefore also be used to study atmospheric rivers and their behaviour under a changing climate. A recent study by Espinoza et al (2018) compared results from 21 different GCMs and found that while the number of atmospheric river events is expected to decrease in the future, both their intensity and duration is expected to increase, meaning longer and more intense periods of heavy rainfall. A recent study found that atmospheric river activity has been increasing along the west coast of North America since 1948, possibly linked to the warming of sea-surface temperatures in the western Pacific as a result of climate change (Gershunov et al, 2017).
Additionally, global temperature increases may lead to more frequent dry periods, producing a see-saw effect of flood and drought that could heavily impact water security for many populations. The combination of these two factors suggests that, with the current trajectory of anthropogenic climate change, the frequency and intensity of weather whiplash events are likely to increase.
JBA can help you to understand your view of flood risk
To better understand the impact of climate change on US flood risk going forwards, JBA have a suite of Flood Data and Probabilistic Flood Models available that represent both baseline and future flood risk. These data and models provide in-depth insights into the potential impact of climate change on flood risk to help users from across the financial and disaster risk reduction sectors. These data combine the highest resolution flood mapping available with modelling the severity and frequency of rainfall and river flooding under a range of future climate scenarios. For more information, please visit the link here or get in touch.
The report is accompanied by a flood footprint for the event, detailing extents and depths of the flooding in areas affected. To request a copy please email eventresponse@jbarisk.com.
This report is covered by JBA’s website terms – please read them here.


