Following several isolated days of intense rainfall across South-East England in July 2021, a number of flood claims were recorded, many of which occurred in London. JBA’s Event Response team has investigated the meteorology of the events and discusses how such high levels of damage occurred, sometimes outside of areas that feature as high flood risk within broad scale nationwide flood maps.
To receive event response updates straight to your inbox, sign up to our mailing list at the end of the report.
Areas affected
12 and 17 July 2021
On 12 July, nearly a month's worth of rain fell in parts of London (BBC, 2021), resulting in 120 Kensington and Chelsea residents being evacuated from their homes (New York Times, 2021).
By lunchtime on the 12th, eight underground lines had been suspended and multiple underground stations had been closed, including Euston Station (Telegraph, 2021). The London Fire Brigade reported over 1,000 calls relating to flooding (BBC News, 2021). Kew, in south-west London, experienced 47.8mm of rainfall in a single hour, compared to an average monthly rainfall of 44.5mm, which makes it Kew’s wettest day since 6 July 1983 (Independent, 2021).
Just five days later, on 17 July, 76mm of rain fell in 90 minutes, causing floods along Portobello Road, with flood levels reaching at least 0.45m (YouTube Guardian News, 2021). Several vintage shops, bars and restaurants along Portobello Road were affected (Figure 5).
25 July 2021
Torrential rain on 25 July 2021 deluged several locations around the south of England. Bethersden in Kent received 48.5mm within one hour, between 3-4pm, while Ryde, on the Isle of Wight, received around 38.5mm (Guardian, 2021a).
Several roads and underground stations in London were affected (Guardian, 2021a). The wettest area in London was St James’s Park which recorded 41.8mm of rainfall in a day. This is close to the total average monthly rainfall for July in London, with average rainfall for the month being 45mm (Guardian, 2021b). JBA’s estimated return period for a daily total of 41.8mm is approximately a 1-in-50 to 1-in-100-year event.
 Figure 1: A General Pareto Distribution curve was fitted to historical records available for the closest location (51.75, -0.25) to St James’s Park, London. The historical rainfall records were obtained from gridded rainfall between 1979 and 2020 from NOAA Physical Science Laboratory, CDC Global Unified Gauge-Based Analysis of Daily Precipitation dataset. Based on a daily total of 41.8mm at St James’s Park, the estimated return period based on rainfall intensity is approximately 50- to 100-years.
Following the floods on 25 July, two hospitals and eight tube stations were closed for a day (Economist, 2021). Among those were Whipps Cross Hospital, which had to evacuate 100 patients due to a power failure (Economist, 2021), and Pudding Mill Lane DLR station, which saw flood waters reach 0.4-0.5m deep. Other areas that were flooded include Nine Elms Park, Hampstead (Economist, 2021), Upper Leytonstone (Figure 2) and Hackney Wick (Figure 3).
Sedgwick, one of the UK's leading loss adjusters, received over 2,000 flood claims across 12 July, 17 July and 25 July. They consider many of these to be large claims (Insurance Post, 2021a).
Aggregate insured losses are yet to be reported but could be expected to be far in excess of £100m. Allianz and LV have announced losses of £15m and £7m respectively (Insurance Post, 2021b).
Performance of broad scale flood maps
Any flooding occurring in London will be heavily (and often sensationally) covered by the media.
However, estimating the realistic impact of urban 'flash flooding' is difficult prior to the development of claims.
Urban flash flooding, or surface water flooding, occurs after a heavy downpour of rain which hits the ground quicker than it can drain or flow away. As a result, water builds up and develops the potential to flood properties.
This type of flooding tends to occur in disconnected areas where there are depressions in the ground or the drainage system has been overwhelmed, making the creation of a footprint challenging. Furthermore, flooding of basements is often not seen in overhead imagery or in the media and only becomes apparent when a claim is made.
The underwriting and pricing of the overwhelming majority of flood insurance in the UK is reliant upon output from broad scale nationwide flood maps. Flood maps indicate areas of increased surface water flood risk, but it's much more difficult to account for local features which can have a significant impact on a property’s flood risk.
Our validation work suggests that JBA’s surface water flood maps are successful at identifying risk in the significant, larger flooded areas that experienced multiple claims.
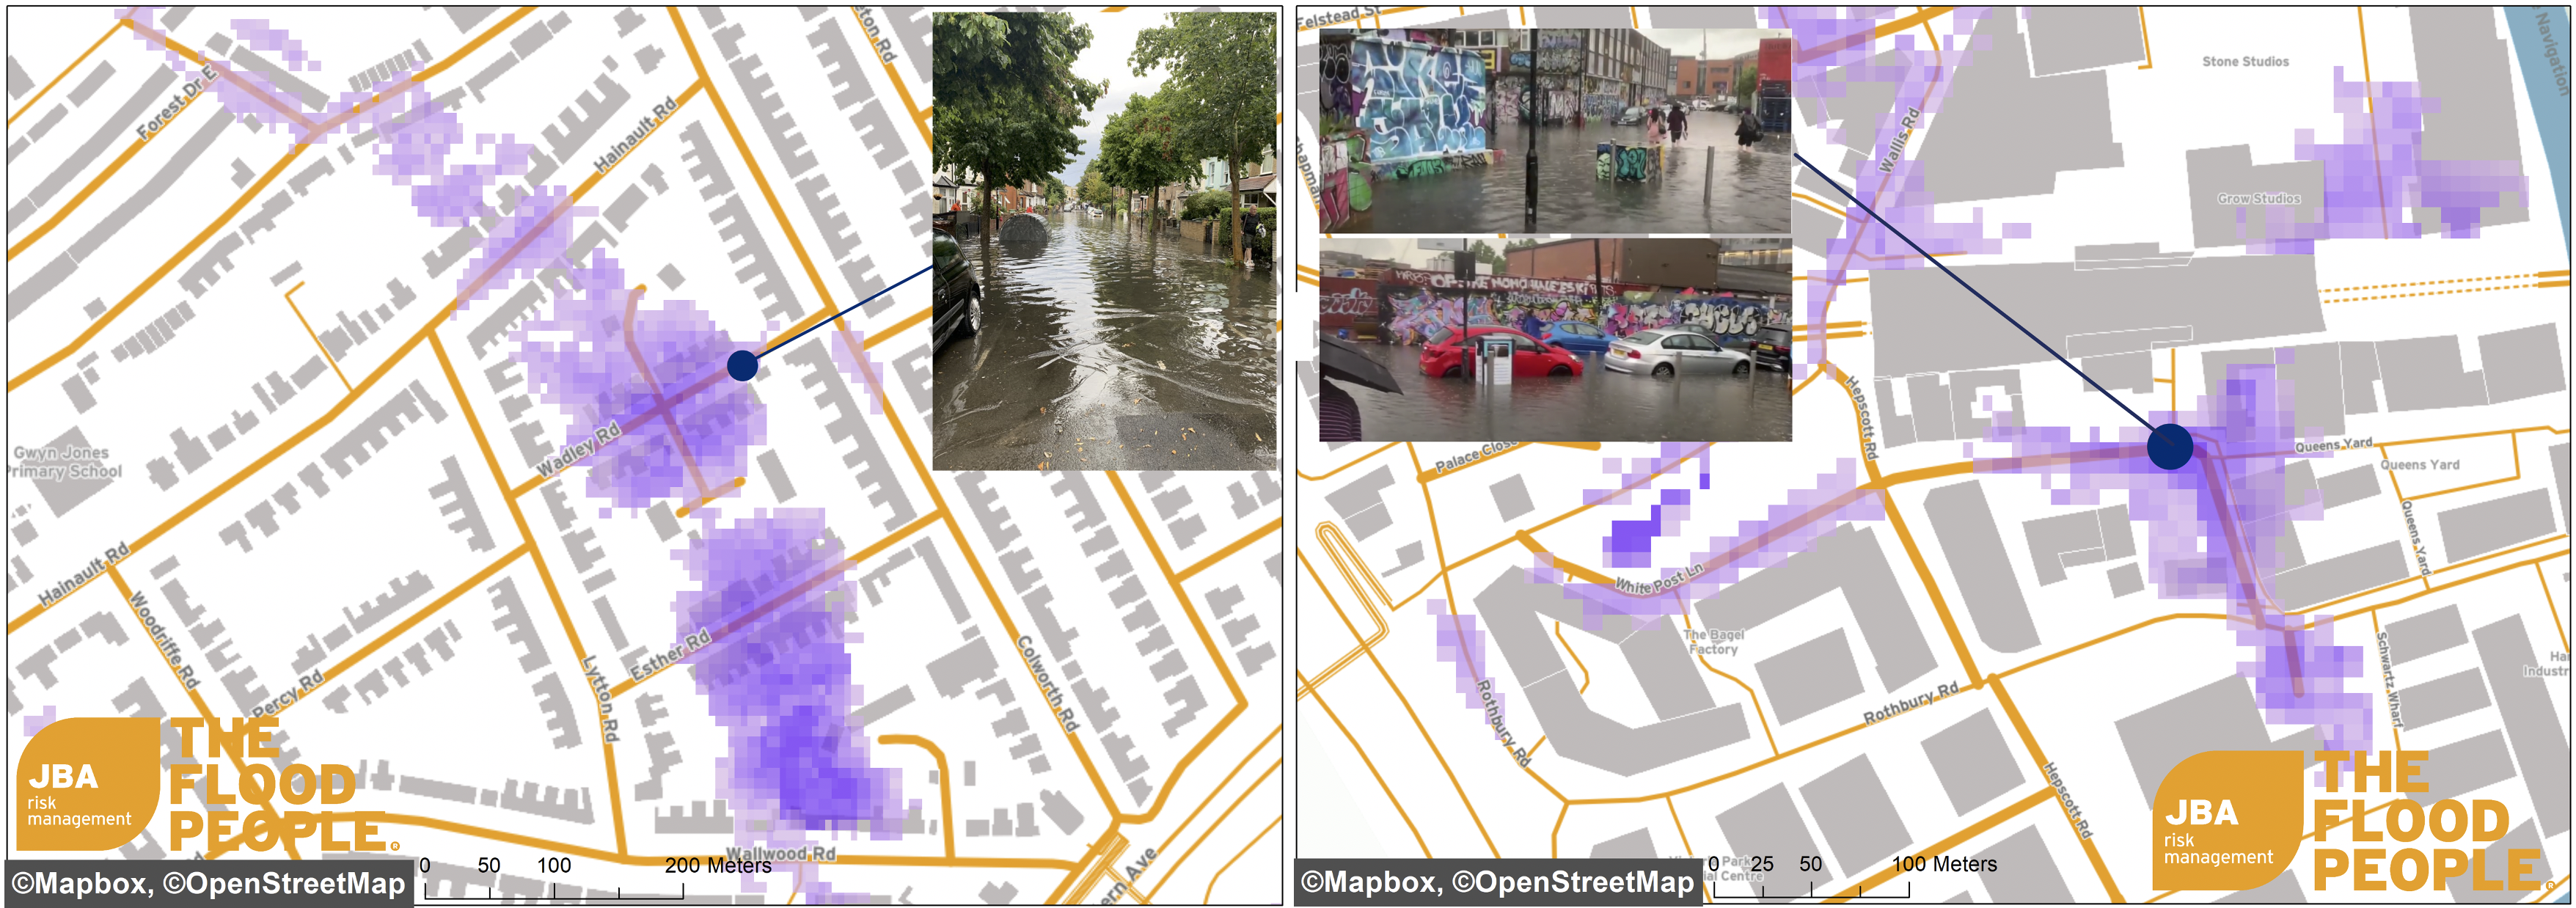 Figure 2 (above left): Floods were reported by Twitter user @KatieAnnSmith to have occurred along Wadley Road, Esther Road and Clare Road, Leytonstone. Another user has seen flood depths of 1.5m in the basement and 0.9m in the garden and at the back of a house on Queens Street.
Figure 3 (above right): Floods occurred outside Hackney Wick station, along White Post Lane. Flood depth is estimated around 0.3-0.4m. JBA Risk Management 1-in-75-year flood map is shown in the figure above. [Image credits: MyLondon.news /Callum Winn]
 Figure 4: Floods were reported in many other areas throughout London which include the following: (a) Nine Elms Road, with estimated flood depths of 0.3-0.4m. JBA 1-in-200-year flood map is shown for illustration. (b) Worchester Park; the low-lying area beneath a bridge was seen to be flooded based on media images. (c) Shops along Longbridge Road were seen to be flooded to around 0.2-0.3m. (d) Residential properties were seen flooded along Vienna Close Road, including Winningales Court. JBA’s 1-in-75-year surface water flood map is shown in images for Worchester Park, Longbridge Road and Winningales Court.
However, some of the recent London flooding was driven by local features such as boundary walls, blocked drains, drain backup and basements, and in some areas, such as Portobello Road, the flood hazard maps did not entirely capture the areas flooded.
Discussions with clients suggests that in these locations, claims were primarily made from properties with basements. Here localised features not captured in broad scale mapping may be coming into play.
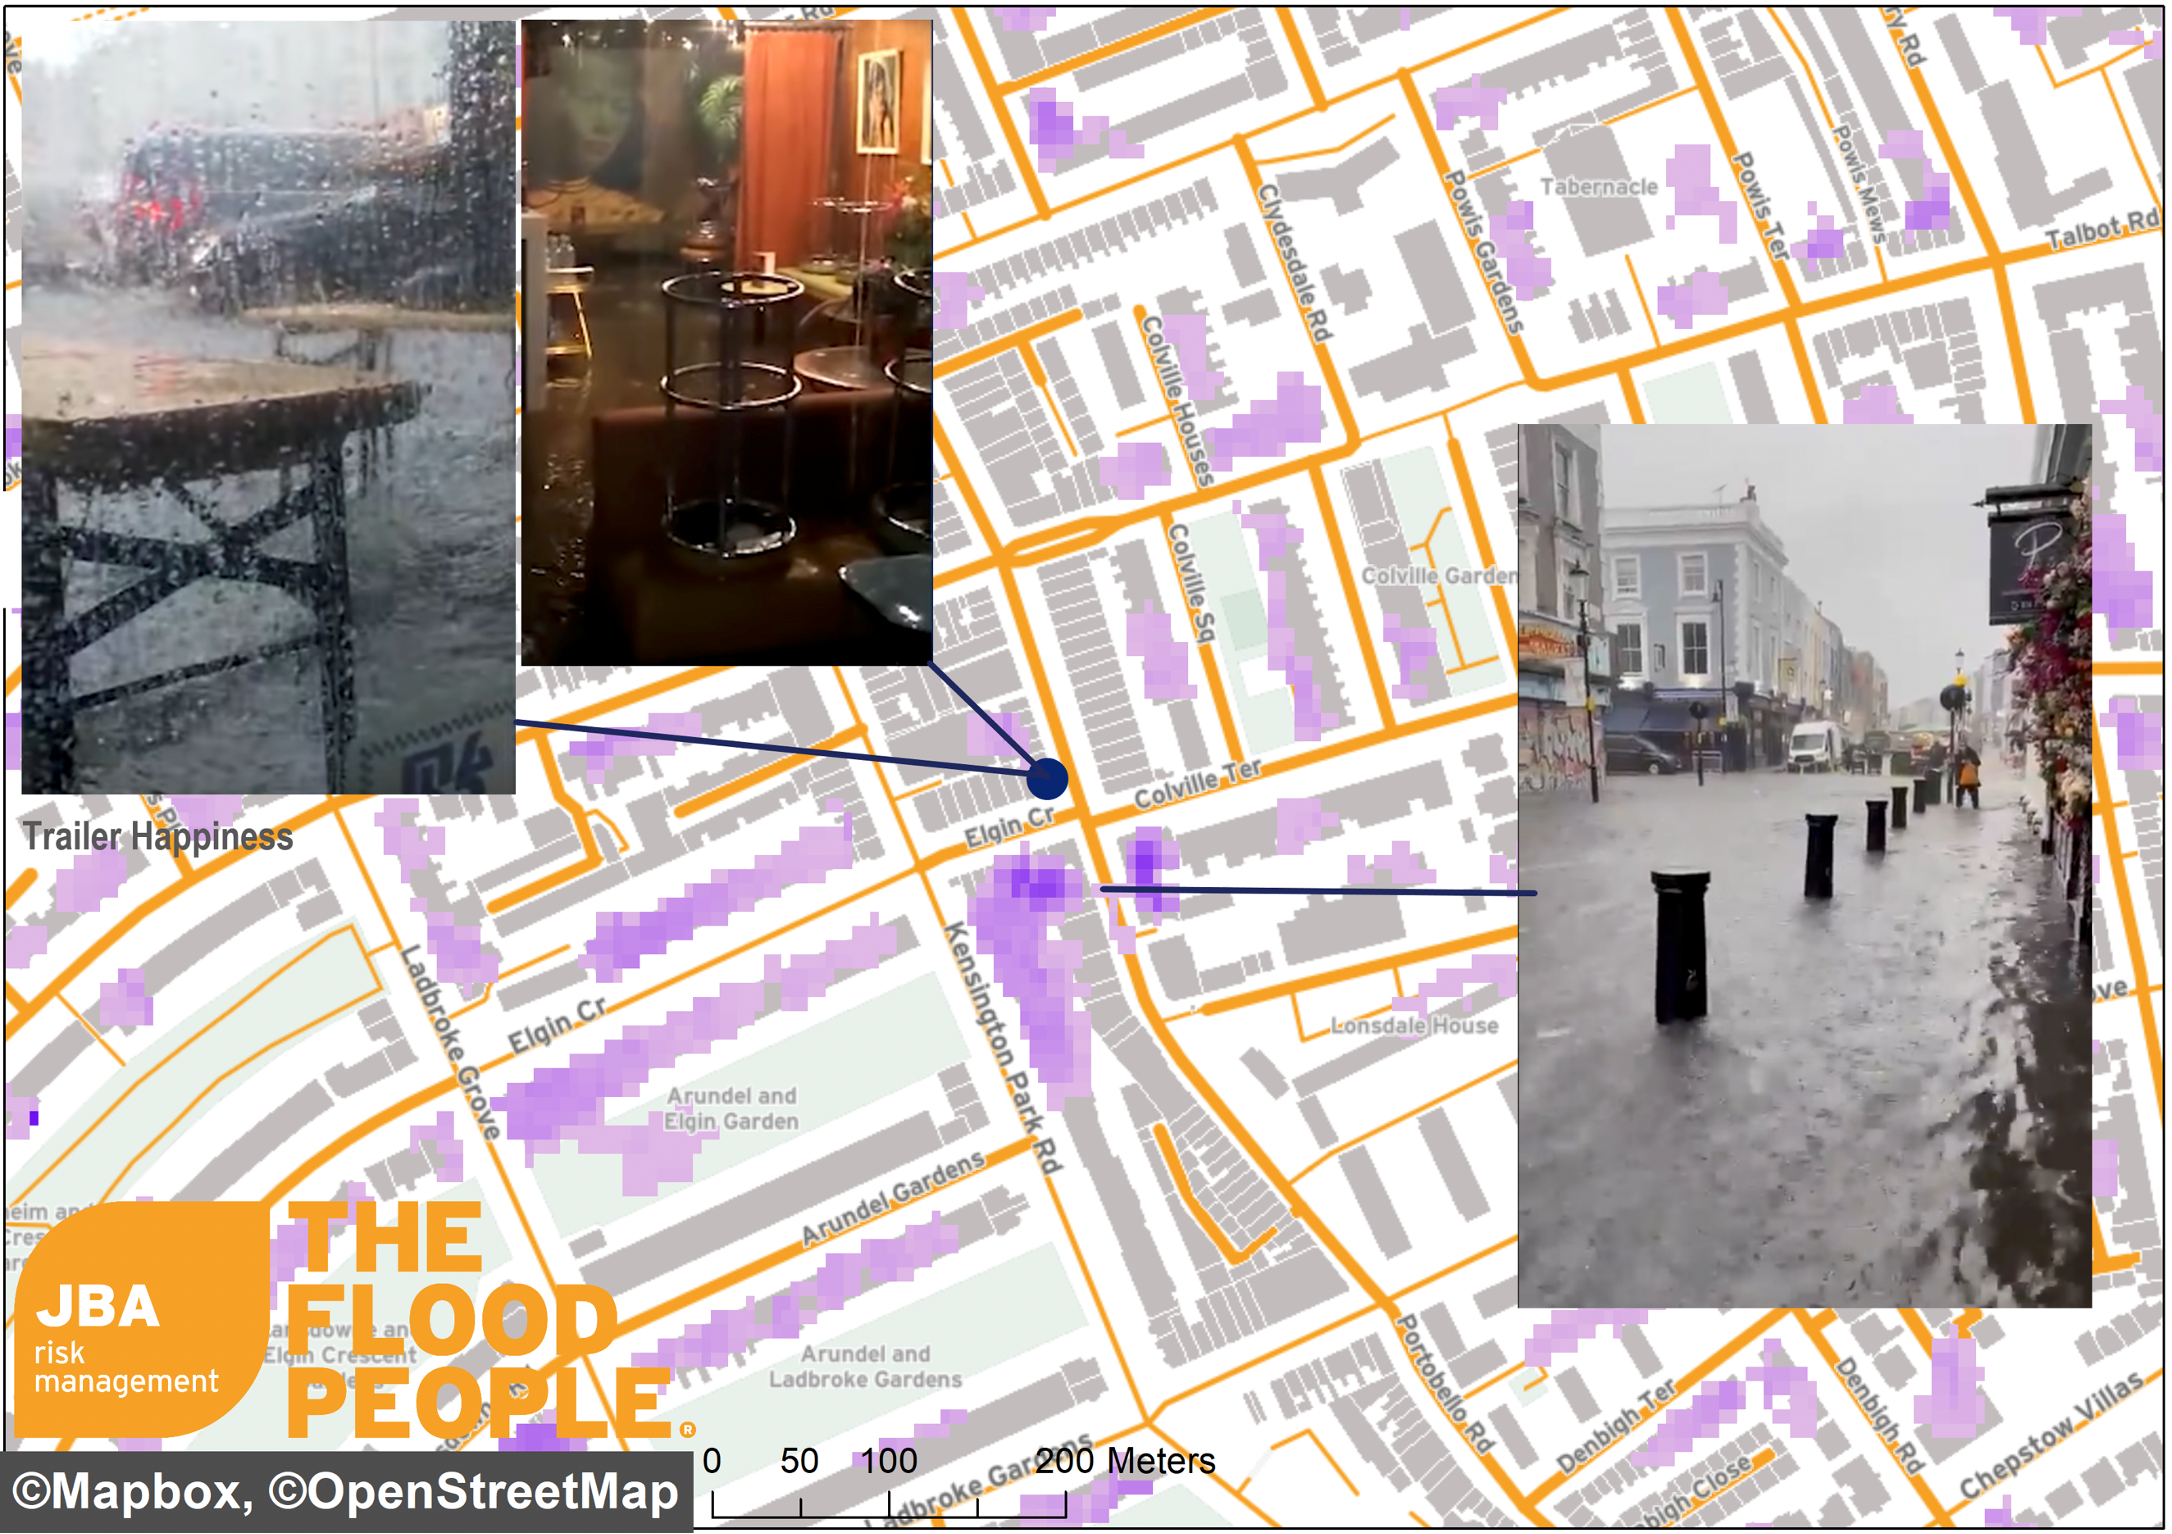 Figure 5: (Insert) Floods along Portobello Road affected many shops and restaurants with basements. Flood depths were between 0.2 to 0.45m. Portobello Road in Notting Hill received 76.2mm of rainfall within 90 minutes. Among the shops affected was Trailer Happiness; owner Joseph Wilkins mentioned that flood depth within the restaurant rose to at least 0.45m rapidly (YouTube / @ The Guardian News, 2021). [Image credits: Twitter / @MrDavidLane, YouTube @ Guardian News / Joseph Wilkins] (Flood Map) JBA Risk Management 75-year return period surface water flood map is shown in the figure.
So why did we experience large losses in London?
Given high property prices within London and the predominance of Georgian and Victorian housing stock, there is a significantly higher proportion of properties with occupied basements. This, coupled with both the predominance of impermeable surfaces for increased rainfall run-off and an aging drainage system, means London properties are highly susceptible to surface water flooding.
The design standard and maintenance of drainage systems varies by location and nationwide data on drainage capacity is not available. JBA's hazard mapping methodology is to assume that rainfall of an intensity up to a default standard will be adequately removed. Any excess water from more severe events will overwhelm the system and contribute to flood extents.
Within many cities, however, the design and construction of drainage system infrastructure lagged behind population growth. The inner London 'Victorian' drainage system was designed for a city of four million, but now has to service nine million. The network is at 80 per cent capacity even in dry weather so has limited capability in times of high rainfall (Mayor of London, 2021).
Surface water flooding is most likely to occur where the drainage system fails, be it due to the drainage reaching capacity, or individual drains being blocked by debris. Furthermore if the drainage system reaches capacity, internal pressure can lead to drainage backup in certain areas or within properties.
This is exacerbated by an increasing trend of moving from gardens to paving, tarmac and concreted areas, which only worsens surface water runoff.
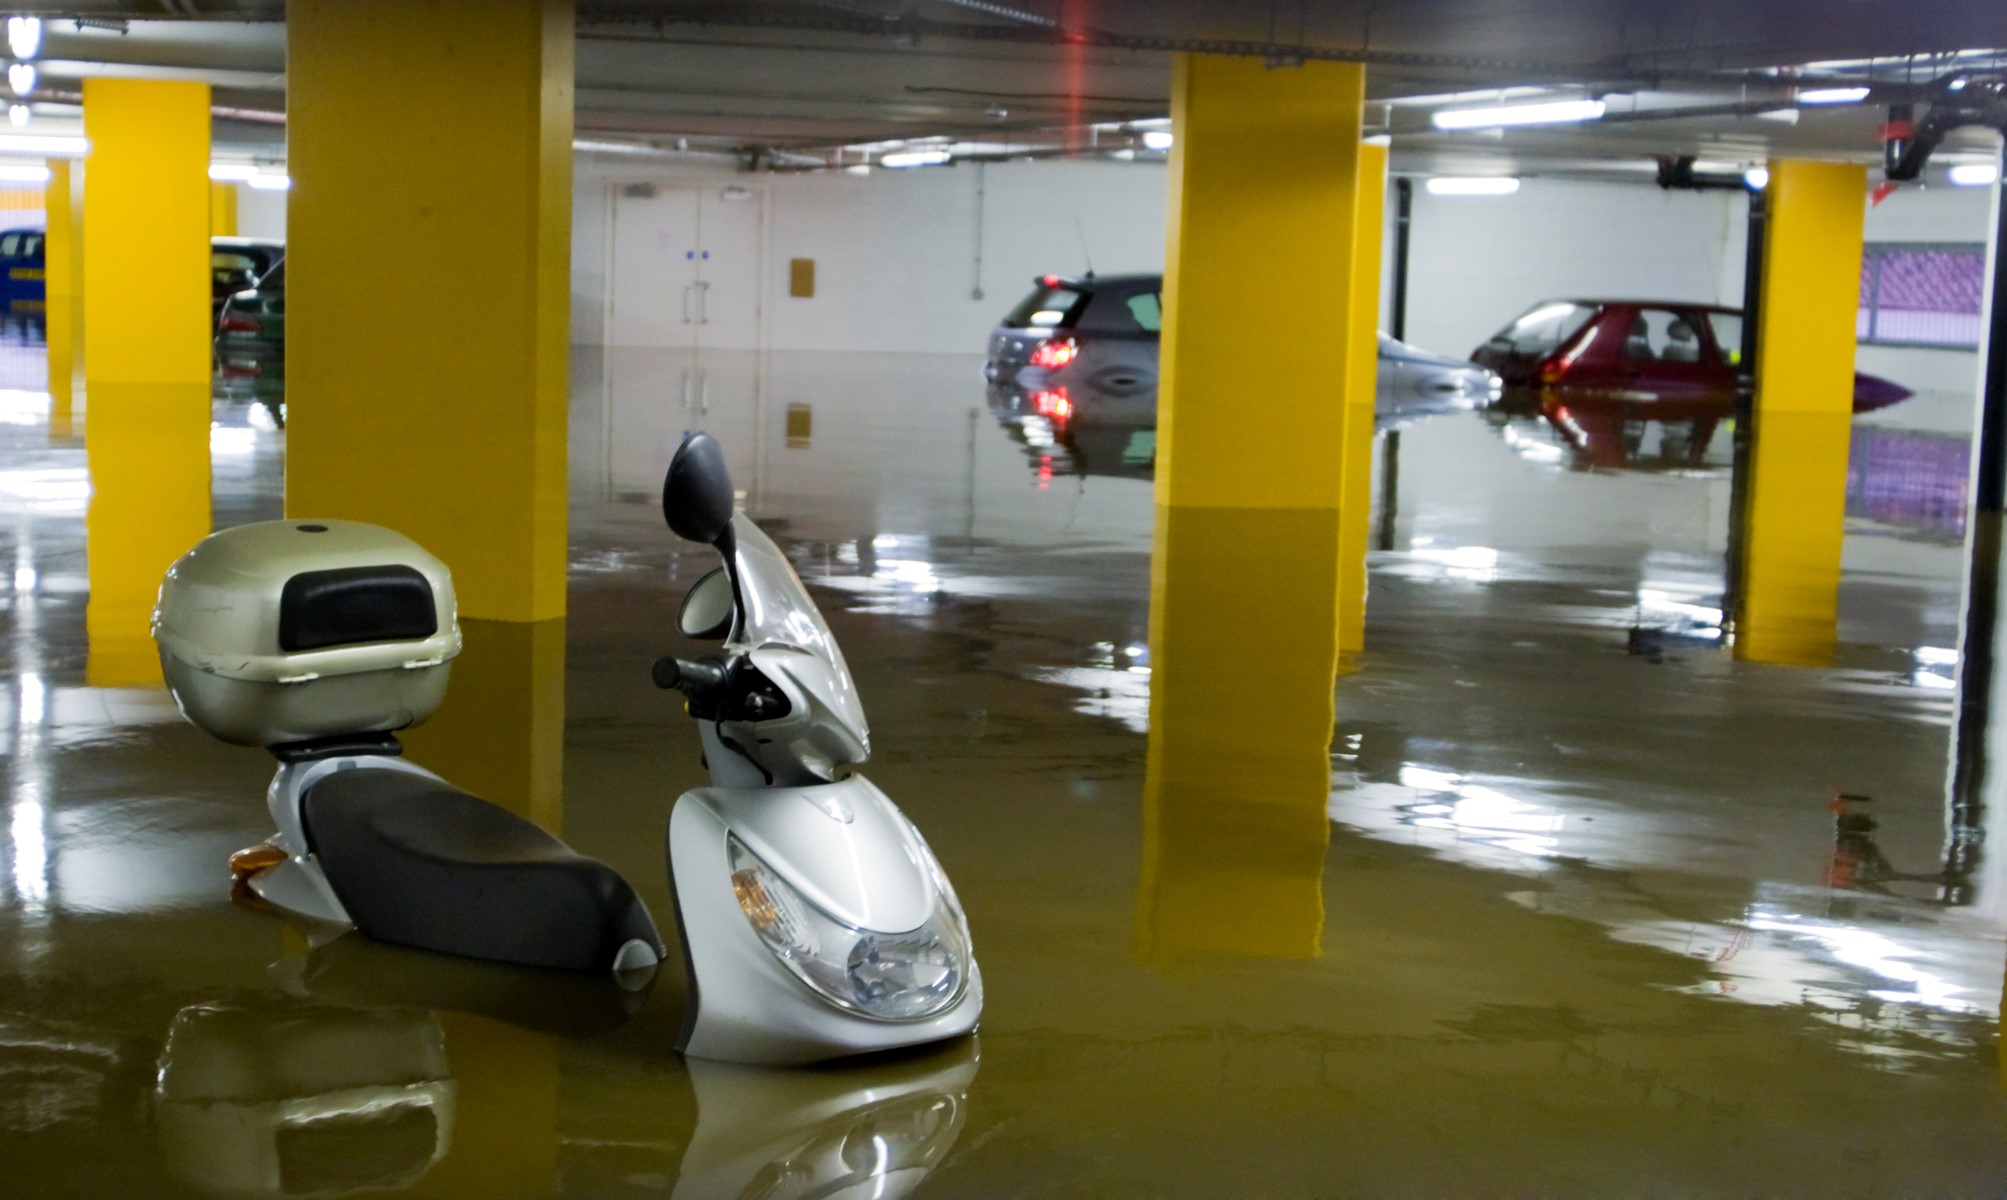
Furthermore, high property prices within London (and other cities) naturally lead to smaller properties, but a higher proportion of properties with basements. London is renowned for having multi-level basements which can often hold high value items and can lead to multimillion-pound claims. Both residential and commercial occupiers often store high value belongings, stock or equipment below ground, and flooding of a basement is likely to be deep, long lasting and expensive to remove.
 Some apartments also exist at basement level and we saw the catastrophic impact of this in the recent New York flooding where 11 people lost their lives in basements.
Basements are invisible from above so don't appear in the height map data used to model flood risk, making it very difficult to represent this risk in flood maps.
Managing the risk
With a projected increase in the frequency of severe storms due to climate change, these problems in dense urban areas will only worsen in the future. Under a 1°C global warming scenario, daily rainfall rates are expected to increase by 6-7%, with sub daily rainfall rates – those causing these short sharp severe downpours as experienced during the July events – likely to increase by 12-14%. This is expected to be compounded by population growth in cities and increased urbanisation.
We are having many conversations with insurance clients around their underwriting and pricing structures, and how to appropriately protect against or price for these events.
Key actions include ensuring that appropriate questions are asked to identify basements and analysing this information against modelled flood metrics. Some insurers are taking advantage of our Unflood data to help them better differentiate risks outside of modelled flood extents (our Unflood data will be explored further in a future blog).
What is certain is that appropriate pricing, underwriting rules and special terms or limits can control exposure. The techniques used in the market continue to evolve. Any insurer with less developed data and capability should be wary of being left behind and picking up more than their share of these less easily identifiable flood risks.
We offer flood mapping and probabilistic flood modelling worldwide, providing flood risk insights at any location globally. This can help re/insurers, financial organisations, and the International Development sector to better understand and manage their flood risk.
To find out more about our flood data and how it can help you, get in touch with the team.
This report is covered by JBA’s website terms – please read them here.
References
BBC, 2021. Flash floods: Parts of London receive a month of rain in one day. [online] Available at: https://www.bbc.com/news/uk-england-london-57816647
Economist, 2021. London’s flooding is sure to worsen. [online] Available at: https://www.economist.com/britain/2021/07/31/londons-flooding-is-sure-to-worsen
Guardian, 2021a. Thunderstorms leave roads and tube stations flooded in London. [online] Available at: https://www.theguardian.com/uk-news/2021/jul/25/thunderstorms-leave-cars-and-buses-stranded-in-london
Guardian, 2021b. East London hospital cancels operations after flooding. [online] Available at: https://www.theguardian.com/uk-news/2021/jul/26/east-london-hospital-cancels-operations-after-flooding
Independent, 2021. London flooding news – live: Tube travel chaos after parts of capital receive month of rain in one day [online] Available at: https://www.independent.co.uk/news/uk/home-news/london-flooding-live-today-news-b1883004.html
Insurance Post, 2021a. Rash of high value claims anticipated after London floods deluge basements. [online] Available at: https://www.postonline.co.uk/claims/7862251/rash-of-high-value-claims-anticipated-after-london-floods-deluge-basements
Insurance Post, 2021b. LV and Allianz saw £22m claims hit from floods and storms in July. [online] Available at: https://www.postonline.co.uk/commercial/7864036/lv-and-allianz-saw-ps22m-claims-hit-from-floods-and-storms-in-july
Mayor of London, 2021. Sustainable drainage in London. [online] Available at: https://www.london.gov.uk/what-we-do/environment/climate-change/surface-water/sustainable-drainage-london
New York Times, 2021. Fierce Storm Inundates London, Bringing City to a Standstill. [online] Available at: https://www.nytimes.com/2021/07/13/world/europe/uk-london-floods.html
Telegraph, 2021. London flooding: Tube and rail networks suspended after month’s worth of rain falls in one day. [online] Available at: https://www.telegraph.co.uk/news/2021/07/13/uk-weather-london-southern-england-hit-torrential-rain-floods/
YouTube Guardian News, 2021. [online] Available at: https://www.youtube.com/watch?v=ANozD7PNflA